|
|||

|
|
|
|||||||||||||||||||||||||||||||||
|
||||||||||||||||||||||||||||||||||||
|
||||||||||||||||||||||||||||||||||||
|
|
||||||||||||||||||||||||||||||||||||
1/16
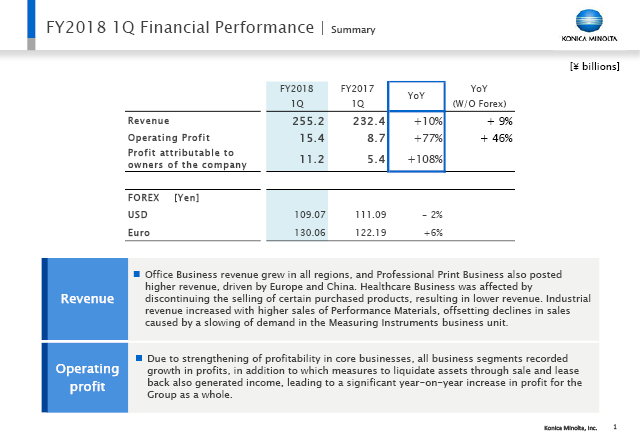
The 1Q results for FY2018 are summarized on page 1. Revenue for 1Q was ¥255.2 billion, which is a 10% increase year-on-year.
The conditions faced by our businesses will be explained in detail in the following pages. The Office Business showed increased revenue in all regions, and revenue also increased in the Professional Print Business; driven by Europe and China. In the Healthcare Business, there was some impact from our discontinuing the handling of certain products supplied to us, resulting in a slight decrease in revenue. In the Industrial Business, the Performance Materials business unit increased its sales, which compensated for the decrease due to stabilized demand in the Measuring Instruments business unit, and this produced an increase in revenue.
Regarding operating profit, core business profitability and strengthening measures are progressing as planned, and all of our business segments showing increased profit. Income from liquidation of assets was one factor yielding a significant increase in profit as a whole, and operating profit reached ¥15.4 billion. Profit attributable to owners of the company was ¥11.2 billion, which is also a significant increase in profit.
2/16
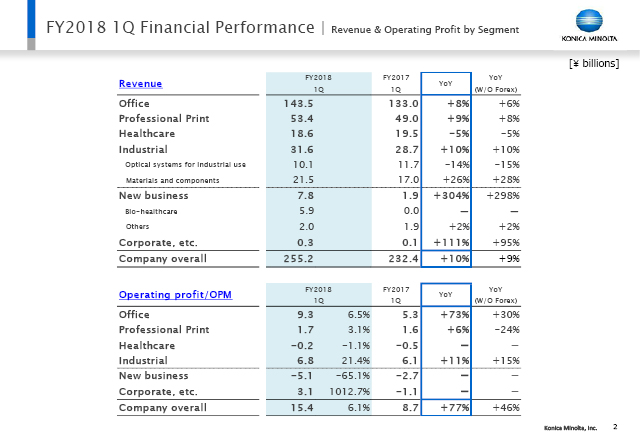
This slide shows revenue by business segment.
Apart from a decrease in revenue in the Healthcare Business, due to the impact of our discontinuing the handling of certain products supplied to us, all business segments showed a rise in revenue.
We also saw an increase in profit across all business segments in operating profit. With the next slide, I will give a slightly more detailed explanation of revenue and operating profit with foreign exchange and special factors excluded.
3/16
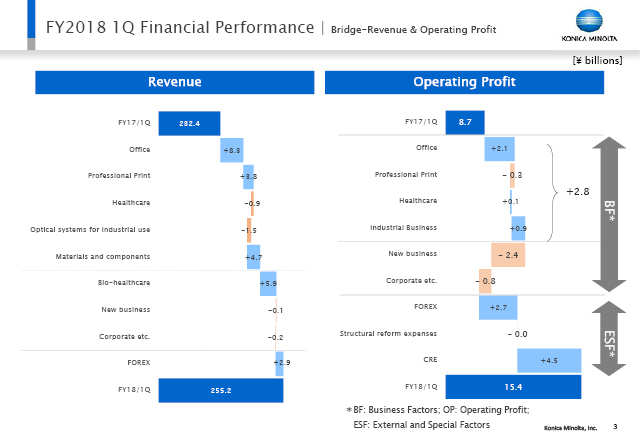
This bridge chart represents revenue and operating profit by business segment. The influence of foreign exchange, asset liquidation, structural reform expenses, and other special factors are excluded.
With the exception of the Healthcare Business, which showed a decrease in revenue, all business segments recorded increased revenue, even with the influence of foreign exchange excluded.
With regard to operating profit, the Office Business shows a ¥2.1 billion increase in profit considering the net difference in structural reform expenses and the impact of foreign exchange. The Professional Print Business showed some decrease in profit because, although the core Production Print Business continues to strengthen its profitability, there was a rise in upfront investment to accelerate growth in the industrial printing business unit, which is the growth business. The Healthcare Business and Industrial Business both showed increased profit, and there was an increase of ¥2.8 billion in profit in the core and the growth businesses.
Our new businesses are progressing according to plan, although expenses have increased year-on-year due to investment for the upcoming launch of Workplace Hub, investment to expand the Bio-healthcare business, and so on.
4/16
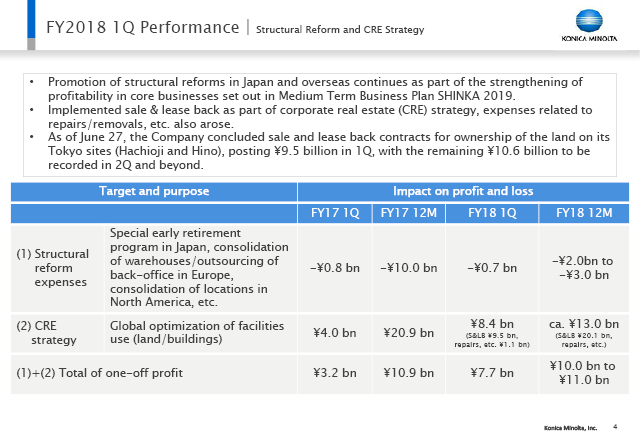
This slide reflects structural reform and corporate real estate (CRE) strategy. One-off expenses amounting to approximately ¥700 million for scheduled structural reform were incurred in the 1Q, mainly for structural reform in Europe. Combined with costs incurred from the 2Q and after, we anticipate an amount between ¥2 and ¥3 billion for the year. In the same quarter last year, about ¥800 million in such expenses was recorded mainly in Japan.
Our CRE strategy, as disclosed on June 27, has been to effectively utilize management resources in order to improve asset efficiency and strengthen our financial structure. Therefore we concluded sale and leaseback contracts for the land rights on our Hachioji and Hino sites in Tokyo, generating 1Q income of ¥9.5 billion. At the same time, repairs and removal expenses of ¥1.1 billion were posted for a net total of ¥8.4 billion. In the same quarter last year, sale and lease back profit amounted to ¥4 billion, making for an increase or decrease of ¥4.5 billion year-on-year. All of these occurred at the corporate level.
Looking at the full fiscal year, we expect to generate income of ¥20.1 billion, and with repair, removal, and other such costs included, we anticipate a net income of around ¥13 billion.
The net figure for one-off income from structural reform expenses and CRE strategy last fiscal year was ¥10.9 billion, and for the current period we envision from ¥10 to ¥11 billion.
5/16
Here I will move on to summary explanations of each business.
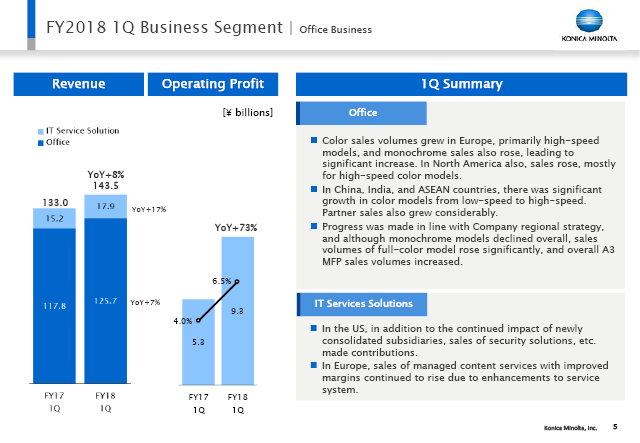
First, in the office products business unit, A3 MFP sales increased significantly in line with the company regional strategy, as did sales of high-speed color products in developed countries. In Europe especially, there was an increase in sales of monochrome models in addition to high-speed color products.
In China, India, ASEAN, and other such countries with growing markets, there was significant growth in sales of color products in all speed segments, and sales through partner channels also grew considerably.
These factors contributed to an increase in A3 MFP unit sales overall due to the significant increase in sales of color products and despite a decline in sales of monochrome models.
Regarding IT service solutions, the impact of new consolidation of subsidiaries in Europe and the U.S. in the last half of the previous fiscal year, in addition to growth of security solutions, managed content services, and other high value-added services, brought increased revenue. As a result, 1Q revenue was ¥143.5 billion, which is an 8% increase. Cost reductions to strengthen profitability proceeded as planned, and together with other factors yielded ¥9.3 billion in operating profit, a 73% profit increase.
6/16
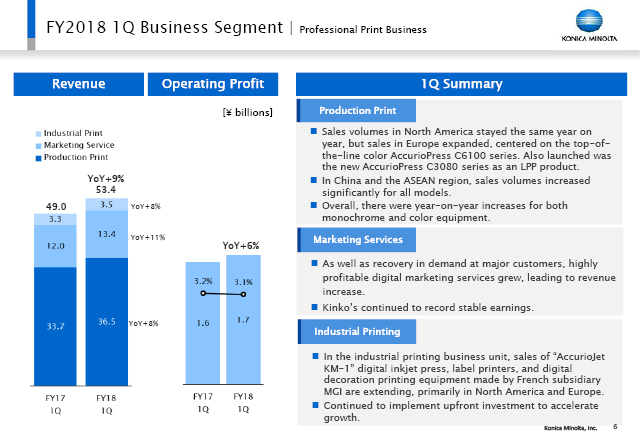
The production print business, which is one of our core businesses, saw unit sales remain at the previous year's level in North America, while sales in Europe continued to expand, mainly in top-of-the-line color models. In China, ASEAN, and other such countries with growing markets, unit sales increased across all model segments. Overall both monochrome and color products showed increases. Sales will also continue to expand from the 2Q In the light production printing field, where we launched the AccurioPress C3080 series and replaced the whole product lineup.
In marketing services, a recovery in demand from our major customers joined with expansion in highly profitable digital marketing services expanded, while Kinko’s continued to record stable income, yielding solid results.
The industrial printing business continues to show growth in sales of value-added products such as the AccurioJet KM-1, label printing equipment, and digital decoration printing equipment, and particularly in America and Europe. We are also continuing to make active investments, such as in the enhancement of highly specialized resources, in order to accelerate the production of income from growing demand.
The result was an increase in both revenue and profits. Revenue in 1Q was ¥53.4 billion, an increase of 9%, and operating profit was ¥1.7 billion, an increase of 6%.
7/16
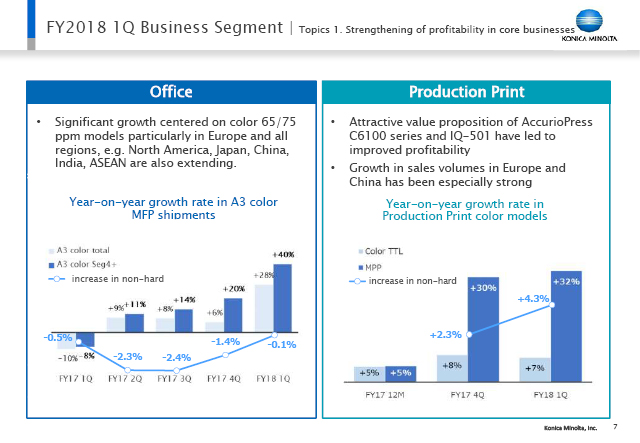
Now I would like to explain how the office products business unit and the production print business unit, which are among our core businesses, are continuing to produce strong results in high value-added sales.
In the office products business unit, sales of color products have continued to expand significantly, particularly in Europe but also in all other regions. The rate of growth is also expanding. The 1Q growth rate for A3 color product sales was 28%. The Seg4 and higher component of that growth, which is highly profitable and is expected to produce non-hard income, had a growth rate of 40%, maintaining a strong momentum from the 4Q of the previous fiscal year.
Because of this, we largely broke even in non-hard revenue, as also stated in the Business Technologies Business briefing we held on June 12. From the 2Q on, we plan to get back onto the growth track and post a year-on-year increase of 1% for the whole year.
We are also continuing to show growth in the production print business unit in unit sales of color products in Europe and China. The mid-range Production Print Business, an area we are concentrating on, is showing a particularly high rate of growth.
In this area, too, the non-hard growth rate saw a major increase from 2.3% in the previous quarter to 4.3% this quarter.
8/16
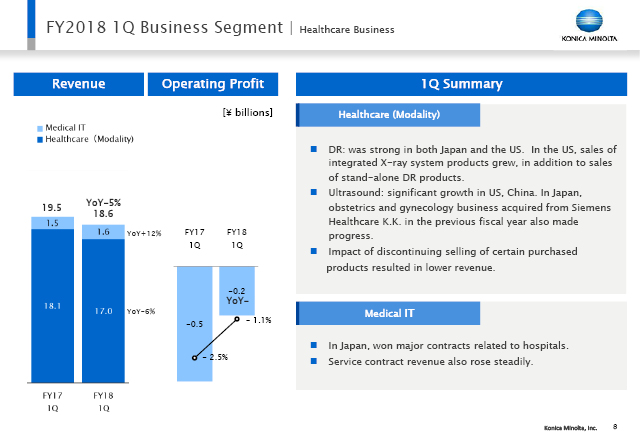
In the Healthcare Business, the overall revenue came to ¥18.6 billion. Due to our discontinuing the sales of purchased products of low profitability, there was a decrease in revenue of 5% year-on-year. Breaking this down, we find that the healthcare (modality) business unit had revenue of ¥17.0 billion, which was a decrease of 6% year on year. However the medical IT business unit had revenue of ¥1.6 billion, which is an increase of 12% year-on-year. Operating profit showed a loss of ¥200 million , but that is an improvement from the previous year’s ¥500 million loss.
In the healthcare (modality) business unit, DR produced strong results in Japan and the US. In the US in particular, sales of stand-alone DR products have been augmented by growing sales of integrated X-ray system products. Sales of diagnostic ultrasound systems showed major growth in the US and China. In Japan, the obstetrics and gynecology business acquired from Siemens Healthcare is also making progress.
The medical IT business unit acquired major contracts for hospitals in Japan and service contract sales also rose steadily.
9/16
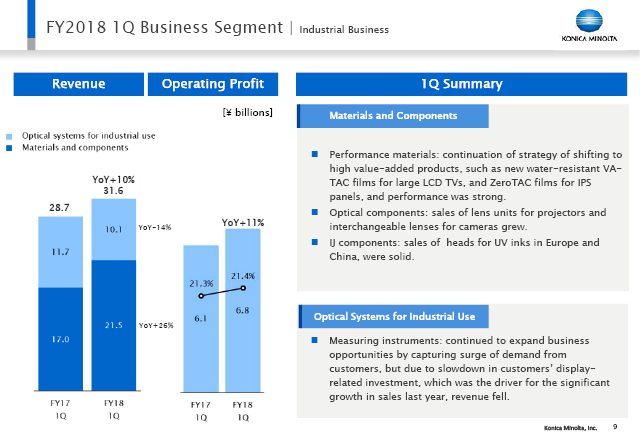
In the Industrial Business, overall revenue rose to ¥31.6 billion, which was a 10% increase year-on-year. Breaking this down, we find revenue of ¥21.5 billion in the materials and components field, which was an increase of 26%. In the field of optical systems for industrial use, revenue was ¥10.1 billion, which was a 14% decrease year-on-year. The business as a whole recorded operating profit of ¥6.8 billion, which is an 11% increase in profit.
In the materials and components field, we pursued a successful strategy in performance materials of shifting to high value-added products, such as new water-resistant VA-TAC films for large LCD TVs and ZeroTAC films for IPS panels, and performance was strong. In the optical component unit, sales of optical units for projectors and interchangeable lenses for cameras saw growth. In the IJ (inkjet) component unit, sales of heads for UV inks were solid in Europe and China.
In the field of optical systems for industrial use, display-related capital investment that had driven a significant increase of revenue in the measuring instruments business unit last year experienced a temporary slowdown, resulting in a decrease in revenue. However, we captured business opportunities by broadening our customer base and expanding our range of applications, and this increased revenue over the previous quarter.
10/16
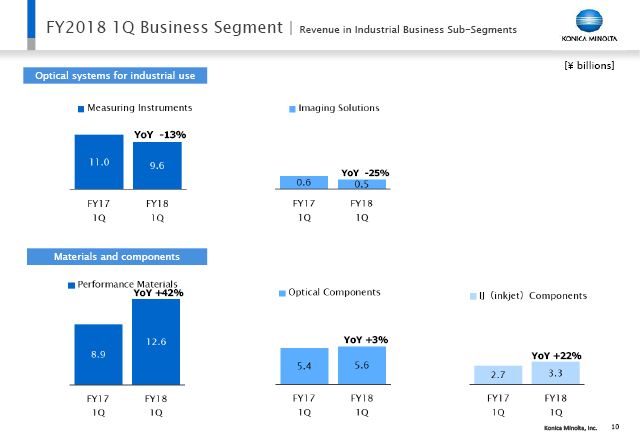
This slide uses graphs to show the 1Q revenue of business units in the Industrial Business in a year-on-year comparison.
We will not go into the details, but the measuring instruments business unit in the field of optical systems for industrial use showed a decrease in revenue for this period due to heavier demand in the same period of the previous year. In the field of materials and components, there was increased revenue year-on-year in all units of performance materials, optical components, and IJ (inkjet) components.
11/16
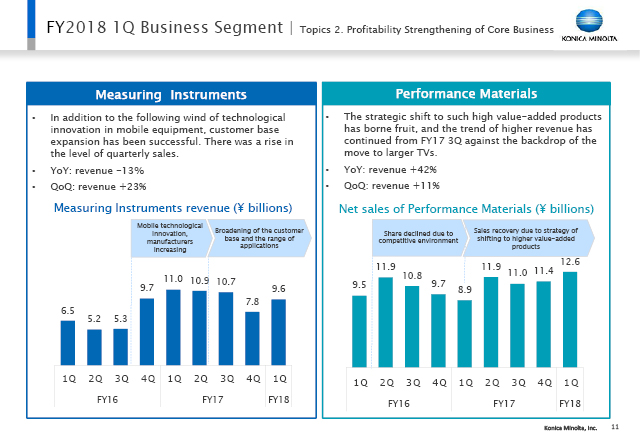
This slide provides a slightly more detailed explanation of the progress of measuring instruments and performance materials in the Industrial Business.
In the measuring instruments business unit, the capital investment by major customers for display-related products that had been a factor in the major revenue growth seen last year settled down from the 3Q in FY2017. However, the impetus of innovative technology in mobile devices combined with successful measures to broaden the customer base has been raising the level of quarterly revenue. As a result, 1Q saw a 13% decrease in revenue year-on-year, but there was a 23% increase in revenue over the previous quarter.
The competitive climate in FY2016 forced the performance materials business unit into a bitter struggle, but from FY2017 on, our sales strategy centered on high value-added products such as new water-resistant VA-TAC films and ZeroTAC films for IPS panels succeeded in the context of the trend toward larger screens, and the trend toward revenue growth is continuing. As a result, revenue increased 42% year-on-year, and there was even an increase of 11% over the last quarter.
12/16
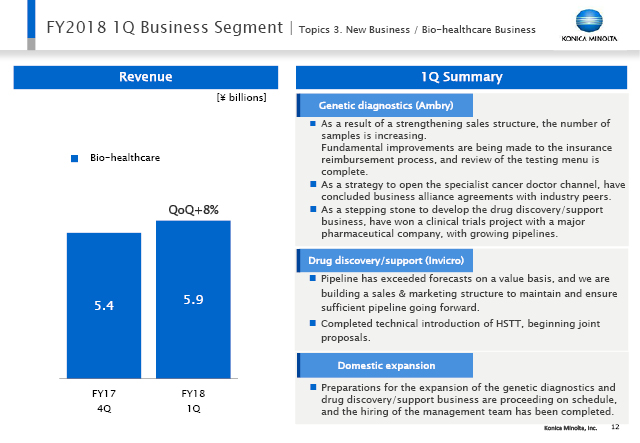
New business has been progressing according to plan since the start of the period as we approach the sales launch of Workplace Hub product and services. Here I will give a more detailed description of progress in the Bio-healthcare business.
While we press ahead with upfront investment in our company's Precision Medicine Business, we are presently concentrating on expanding our sales. Revenue in the 1Q was ¥5.9 billion, therefore, by comparison with ¥5.4 billion in the 4Q of the previous fiscal year.
As to genetic diagnostic services, we have been strengthening our sales organization as a measure to expand market shares in the genetic counselor market, which is one of our strengths, and we are seeing an increase in the number of samples submitted to us for testing. Together with the simplification of the insurance reimbursement process and a review of the testing menu, the effects are emerging. We are taking measures to expand sales channels by concluding business alliance agreements with industry peers as a strategy to open up the market for cancer specialists, and we are now working toward full-scale operation. As a measure toward expanding the new business of support for pharmaceutical development, we won a clinical trials project with a major pharmaceutical company in the 1Q, and our pipelines, including those to other potential customers, are increasing.
Regarding the new support system for pharmaceutical development, the pipeline has exceeded forecasts on a value basis, but we have put in place a sales and marketing structure in order to enlarge our pipeline without relaxing our firm grasp on it. In addition, we have completed the implementation of our proprietary HSTT, a technology for quantifying protein expression, and we have begun to make joint proposals.
Currently, this service is available mainly in the US. However, we are preparing to launch the genetic diagnosis service and the new support system for pharmaceutical development in Japan in advance of our global deployment in the medium term. Progress is presently taking place as planned, to include the hiring of a management team.
13/16
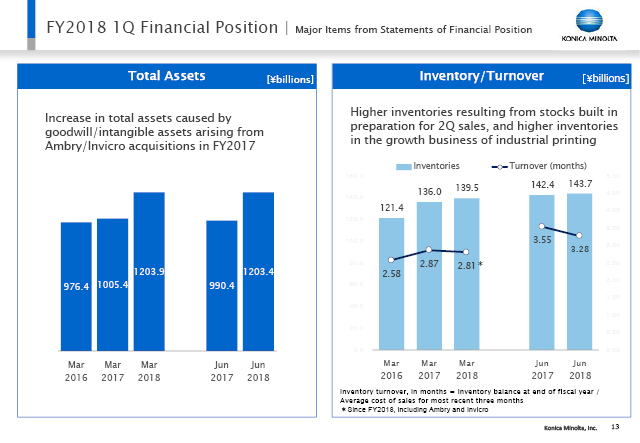
Looking now at total assets, there have not been any major changes since the end of the last fiscal year. Inventory has grown somewhat, but stocks have been built in preparation for 2Q sales due to the momentum of continued strong sales, and in the in growth businesses, inventories are higher in Industrial Printing where unit sales are soaring. The number of inventory turnover months has diminished year-on-year, and we consider the level of inventory to be appropriate.
14/16
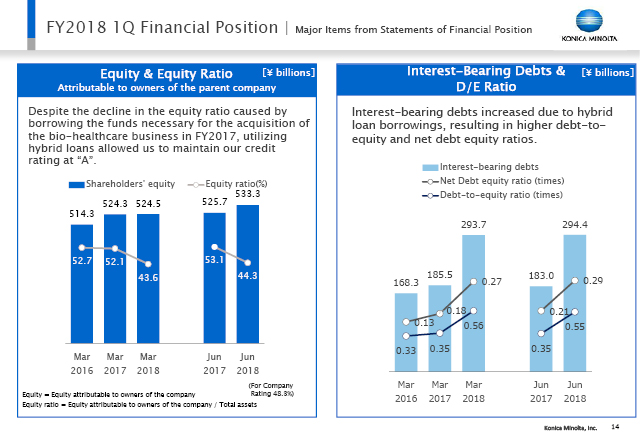
As to equity and equity ratio attributable to owner of the parent company, increased profits have brought improvement since the end of the previous fiscal year. Interest-bearing debt has increased since the end of the previous fiscal year, but this is an effect of exchange conversion.
15/16
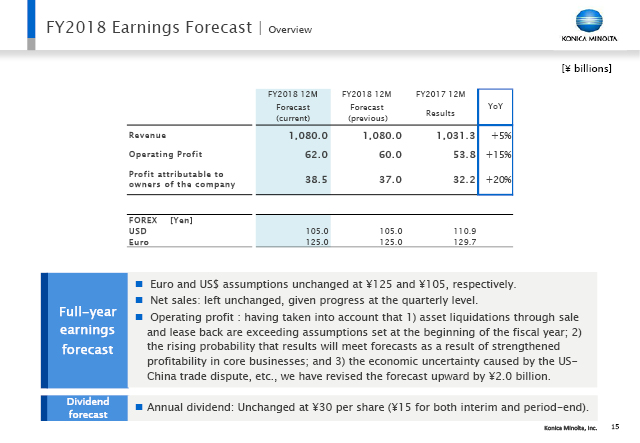
In conclusion, I will explain our earnings forecast.
Our view of foreign exchange rates is formed in view of the market environment and similar factors, and takes into account uncertainty about the future of the economy, interest rate trends in Europe and the US, and so on. The rates envisioned at the beginning of the term remain accordingly at ¥125 for the euro and ¥105 for the dollar.
Revenue in each segment is making strong progress at a slightly faster pace than initially planned, and we see a growing probability that forecasts will be met. At present, however, the revenue forecast stands.
Regarding operating profits, income from asset liquidation is now anticipated to exceed assumptions at the start of the period by around ¥2 billion. In our businesses, strengthened profitability in core businesses and other such factors, and taking into account the growing probability that initial forecasts will be met, we have decided to revise the forecast operating profit upward. Taking into account the continuing uncertainty about the economic outlook, among other factors, we are revising the amount of profit increase upward by ¥2 billion for the company as a whole. Therefore we are also making a corresponding upward revision in the profit attributable to owners of the company, from the scheduled ¥37 billion to ¥38.5 billion.
The dividend forecast remains unchanged.
16/16


The conditions faced by our businesses will be explained in detail in the following pages. The Office Business showed increased revenue in all regions, and revenue also increased in the Professional Print Business; driven by Europe and China. In the Healthcare Business, there was some impact from our discontinuing the handling of certain products supplied to us, resulting in a slight decrease in revenue. In the Industrial Business, the Performance Materials business unit increased its sales, which compensated for the decrease due to stabilized demand in the Measuring Instruments business unit, and this produced an increase in revenue.
Regarding operating profit, core business profitability and strengthening measures are progressing as planned, and all of our business segments showing increased profit. Income from liquidation of assets was one factor yielding a significant increase in profit as a whole, and operating profit reached ¥15.4 billion. Profit attributable to owners of the company was ¥11.2 billion, which is also a significant increase in profit.