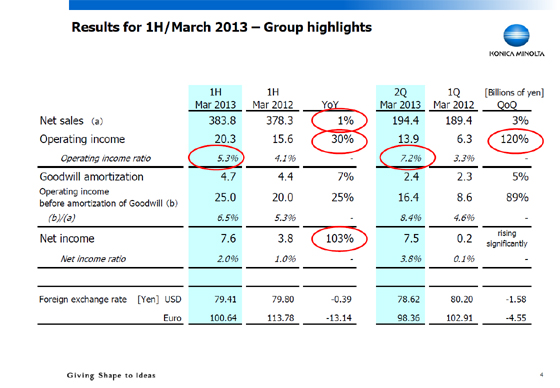
This slide compares the Group's performance during the first half with that of the previous first half, and the performance during the second quarter with that of the previous quarter. The main points have been circled in red, and you can see that both net sales and operating income are up when comparing the first half with the previous first half and the second quarter with the previous quarter.