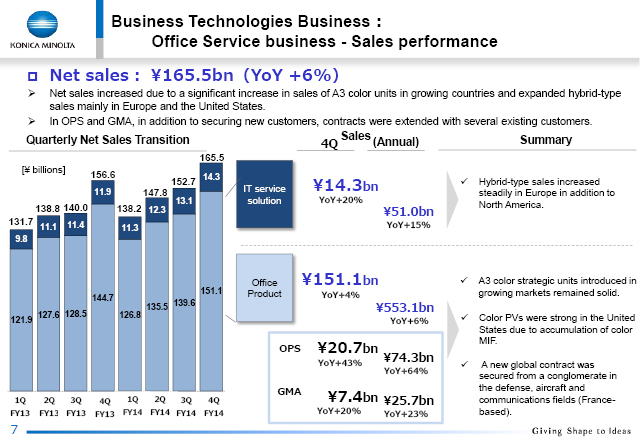
This chart shows net sales of office services on a quarterly basis.
One key factor behind these results is that net sales from OPS promoted by the Company and GMA both increased on an annual basis by 64% and 23% year on year to ¥74.3 billion ¥25.7 billion, respectively.
The total gross profit margin was 50.3% last year and 50.6% this year in the Business Technologies Business, and also increased slightly from 51.0% to 51.5% in the office services field, with a higher proportion of net sales attributed to the OPS and GMA businesses.