
Comparative Consolidated Balance Sheets (Summary)
(Millions of yen)
| FY2012 As of March 31, 2012 |
FY2013 As of March 31, 2013 |
|
|---|---|---|
| ASSETS | ||
| Current assets | 10,832 | 10,292 |
| Fixed assets | 7,584 | 8,177 |
| Tangible fixed assets | 6,387 | 6,932 |
| Non-Tangible Fixed Assets | 193 | 204 |
| Investments and others assets | 1,004 | 1,040 |
| Total assets | 18,416 | 18,469 |
| LIABILITIES | ||
| Current liabilities | 11,461 | 10,437 |
| Fixed Liabilities | 3,988 | 3,960 |
| Total liabilities | 15,449 | 14,397 |
| NET ASSETS | ||
| Shareholders' equity | 4,457 | 4,934 |
| Common stock | 3,451 | 1,000 |
| Capital surplus | 2,551 | 256 |
| Retained earnings | -1,541 | 3,682 |
| Treasury stock | -3 | -4 |
| Total accumulated other comprehensive income | -1,702 | -878 |
| Valuation gain (loss) on other securities | -4 | 21 |
| Foreign exchange adjustment | -1,698 | -899 |
| Warrants | 16 | 16 |
| Minority interests | 195 | - |
| Total net assets | 2,967 | 4,072 |
| Total liabilities and net assets | 18,416 | 18,469 |
Comparative Consolidated Profit and Loss Statements (Summary)
(Millions of yen)
| FY2012 As of March 31, 2012 |
FY2013 As of March 31, 2013 |
|
|---|---|---|
| Net sales | 25,191 | 23,551 |
| Cost of sales | 19,849 | 18,752 |
| Gross profit | 5,341 | 4,798 |
| Selling, general and administrative expenses | 4,728 | 4,371 |
| Operating income | 612 | 426 |
| Non-operating revenues | 273 | 429 |
| Non-operating expenses | 416 | 314 |
| Ordinary income | 470 | 542 |
| Extra ordinary gain | 190 | 191 |
| Extra ordinary loss | 347 | 85 |
| Net Income before Income Taxes | 312 | 648 |
| Corporate, Inhabitant and Enterprise Taxes | 114 | 146 |
| Corporate Tax Adjustments | -17 | 23 |
| Minority interests | -10 | - |
| Net income | 226 | 478 |
Comparative Consolidated Statements of Cash Flows (Summary)
(Millions of yen)
| FY2012 As of March 31, 2012 |
FY2013 As of March 31, 2013 |
|
|---|---|---|
| Cash flows from operating activities | 1,435 | 1,857 |
| Cash flows from investing activities | -802 | -1,275 |
| Cash flows from financing activities | -248 | -1,002 |
| Effect of exchange rate changes on cash and cash equivalents | -49 | 248 |
| Net increase (decrease) in cash and cash equivalents | 334 | -171 |
| Cash and cash equivalents at the beginning of year | 2,464 | 2,534 |
| Decrease in cash and cash equivalents resulting from exclusion of subsidiaries from consolidation | -265 | - |
| Cash and cash equivalents at the end of quarter | 2,534 | 2,362 |
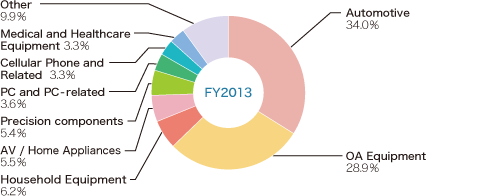
Net Sales by Market
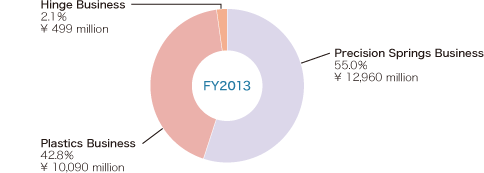
Net Sales by Business Segment
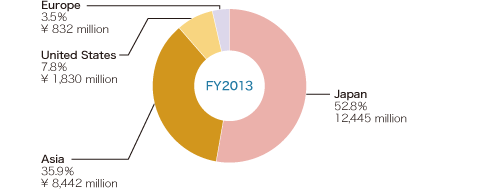
Net Sales by Geographic Segment