
Comparative Consolidated Balance Sheets (Summary)
(Millions of yen)
| FY2011 As of March 31, 2011 | FY2012 As of March 31, 2012 |
|
|---|---|---|
| ASSETS | ||
| Current assets | 13,090 | 10,832 |
| Fixed assets | 7,668 | 7,584 |
| Tangible fixed assets | 6,620 | 6,387 |
| Intangible fixed assets | 221 | 193 |
| Investments and others assets | 826 | 1,004 |
| Total assets | 20,758 | 18,416 |
| LIABILITIES | ||
| Current liabilities | 12,517 | 11,461 |
| Long-term liabilities | 5,080 | 3,988 |
| Total liabilities | 17,598 | 15,449 |
| NET ASSETS | ||
| Shareholders' equity | 4,120 | 4,457 |
| Common stock | 3,451 | 3,451 |
| Capital surplus | 2,571 | 2,551 |
| Retained earnings | -1,768 | -1,541 |
| Treasury stock | -134 | -3 |
| Total accumulated other comprehensive income | -1,666 | -1,702 |
| Valuation gain (loss) on other securities | 0 | -4 |
| Foreign exchange adjustment | -1,667 | -1,698 |
| Warrants | 23 | 16 |
| Minority interests | 682 | 195 |
| Total net assets | 3,160 | 2,967 |
| Total liabilities and net assets | 20,758 | 18,416 |
Comparative Consolidated Profit and Loss Statements (Summary)
(Millions of yen)
| FY2011 As of March 31, 2011 | FY2012 As of March 31, 2012 |
|
|---|---|---|
| Net sales | 31,459 | 25,191 |
| Cost of sales | 25,266 | 19,849 |
| Gross profit | 6,192 | 5,341 |
| Selling, general and administrative expenses | 5,640 | 4,728 |
| Operating income | 552 | 612 |
| Non-operating revenues | 264 | 273 |
| Non-operating expense | 490 | 416 |
| Ordinary income | 326 | 470 |
| Extra ordinary gain | 25 | 190 |
| Extra ordinary loss | 824 | 347 |
| Income (loss) before income taxes | -471 | 312 |
| Income, local and enterprise taxes | 277 | 114 |
| Adjustment for income taxes | 21 | -17 |
| Minority interests | -618 | -10 |
| Net income | -152 | 226 |
Comparative Consolidated Statements of Cash Flows (Summary)
(Millions of yen)
| FY2011 As of March 31, 2011 | FY2012 As of March 31, 2012 |
|
|---|---|---|
| Cash flows from operating activities | 1,068 | 1,435 |
| Cash flows from investing activities | -792 | -802 |
| Cash flows from financing activities (loss) | -846 | -248 |
| Cash and cash equivalents at the end of quarter | -130 | -49 |
| Effect of exchange rate changes on cash and cash equivalents | -701 | 334 |
| Net increase (decrease) in cash and cash equivalents | 3,165 | 2,464 |
| Cash and cash equivalents at the beginning of year | 2,464 | 2,534 |
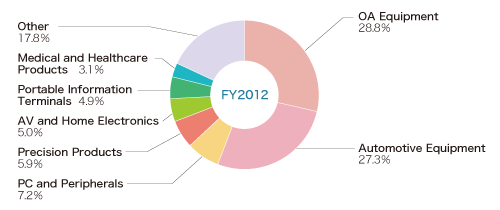
Net Sales by Market
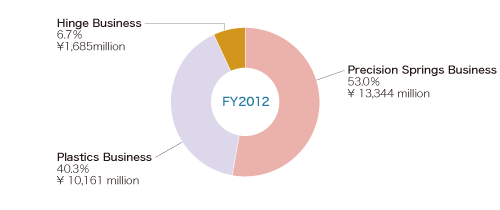
Net Sales by Business Segment
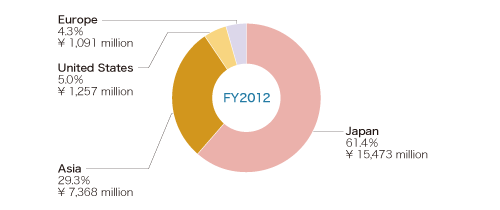
Net Sales by Geographic Segment