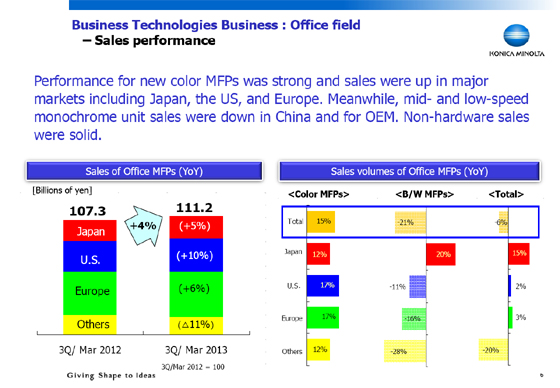
This slide provides an explanation on office MFP sales conditions. On the left of the slide, a graph displays a year-on-year comparison of regional sales composition for the third quarter. To the right is a graph that displays changes in sales volumes by region for color units and monochrome units.
First, we will look at the graph to the right on the growth in sales volumes of color MFPs were driven by strong sales of new products in the major US and European markets that were launched during the first half of the year, and double-digit growth was experienced in regions worldwide, including Japan, the US, Europe, and Other regions. Meanwhile, sales of monochrome units declined significantly in "Other regions" that account for approximately 50% of sales volumes. Major factors leading to this decline include conservative purchases by dealers in China due to the continuing economic slowdown and the negative impact of the deterioration of market conditions for a part of the OEM business.
As a result of these factors, while sales increased in the office field in Japan, the US, and Europe, sales decreased for monochrome units that are central for sales in "Other regions."
As for non-hardware sales, sales were up year on year on both a nine-month basis and for the third quarter, as can be seen in the figures for the year-on-year growth rate by region under "Supplementary Information" on page 21 in the second half of this report. We will look at this in further detail later.