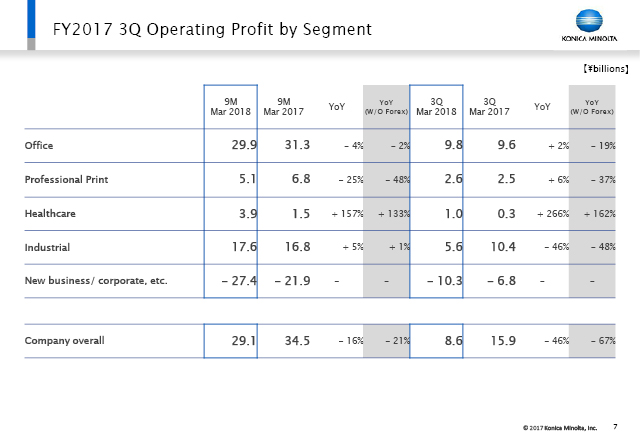
This slide shows operating profit by segment in comparison with the previous years results.
The graph we just looked at showed an overview of the increase or decrease for the business segments. This is a negative figure again for 3Q new business, corporate, and so on. The main factor in this is the strategic upfront investment we are making for growth in new business that will become a future profit center, including the bio-healthcare business, the Workplace Hub, and so on.


The graph we just looked at showed an overview of the increase or decrease for the business segments. This is a negative figure again for 3Q new business, corporate, and so on. The main factor in this is the strategic upfront investment we are making for growth in new business that will become a future profit center, including the bio-healthcare business, the Workplace Hub, and so on.