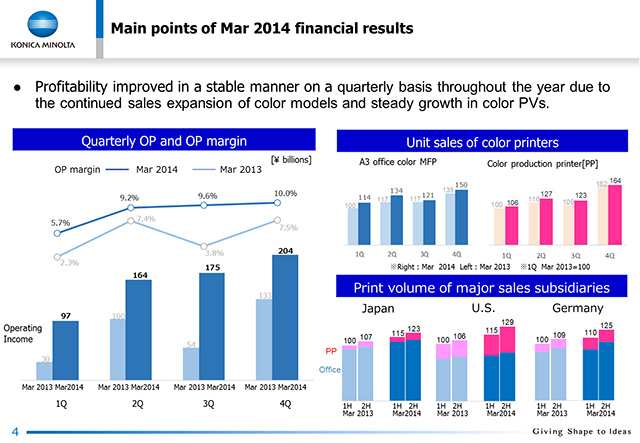
The Business Technologies Business was the driving force during the term. The graph on the left shows that operating income rose steadily during each quarter, with the fourth quarter producing an operating income margin of 10%.
The results can be explained in part by our push to sell A3 office color MFPs and color production printers. As the graph on the upper right shows, year-on-year sales of these products were up in each quarter. As those sales increased, print volumes also expanded in each region. The figure on the lower right shows the trends in print volumes of sales subsidiaries in Japan, the US, and Europe . In all regions, volumes rose solidly year on year. Production printing especially made an increasing contribution.


The results can be explained in part by our push to sell A3 office color MFPs and color production printers. As the graph on the upper right shows, year-on-year sales of these products were up in each quarter. As those sales increased, print volumes also expanded in each region. The figure on the lower right shows the trends in print volumes of sales subsidiaries in Japan, the US, and Europe . In all regions, volumes rose solidly year on year. Production printing especially made an increasing contribution.